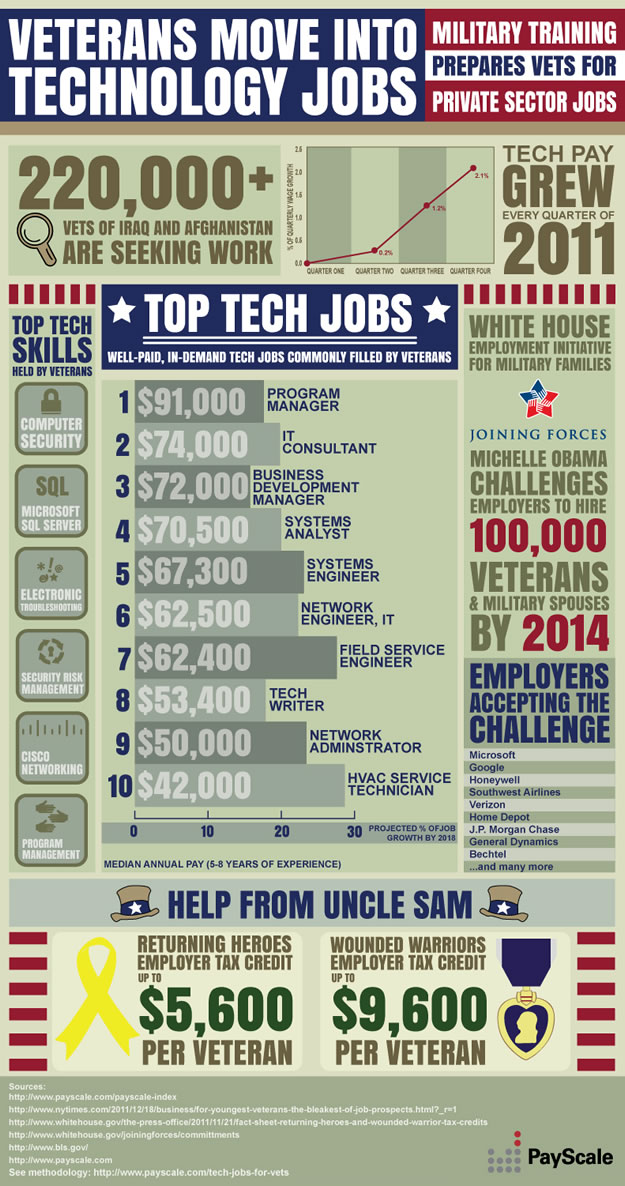
Article and infographic from www.payscale.com
As US troops return home from Iraq and Afghanistan, what sorts of jobs are they well-trained for and likely to find? Technology jobs top the list, according to PayScale’s research.
See the methodology for the infographic below:
Methodology
Top Tech Jobs: Top tech jobs were chosen by their growth potential, pay and the frequency of veterans working in these jobs.
Growth Potential: Growth was calculated by dividing the Bureau of Labor Statistics (BLS) predicted growth rate for 2008-2018 for a specific job by the national expected growth rate of 10.2 percent.
Pay: The median pay is the national median (50th Percentile) annual total cash compensation. Half the people doing the job earn more than the median, while half earn less. Note: These pay numbers were generated using data from all employees, not just veterans’ salaries. For this study, employees with between five to eight years of experience were considered.
Veteran Frequency: Frequency refers to how common it is for veterans to have a given job compared to the national average, namely determining what percentage of veterans have a certain job, and comparing that percentage to the same percentage for all employees.
Total Cash Compensation (TCC): TCC combines base annual salary or hourly wage, bonuses, profit sharing, tips, commissions, and other forms of cash earnings, as applicable. It does not include equity (stock) compensation, cash value of retirement benefits, or value of other non-cash benefits (e.g., healthcare).
Years of Experience: These are the number of years in the field/career. Therefore, the years of experience will incorporate all applicable jobs in the field, not just the current job.
